


When analyzing a given stock, market, or asset class I first look at long term charts to gain an understanding of the context. Knowing where we have been and where we have come from can help to understand where we might be going, in addition to gaining an understanding of longer term trends.
Looking at the chart of $URA from its inception we can quickly deduce that the uranium sector is in a longer term bear market:
URA (Weekly - since inception)

Within long term secular bear markets there are counter-trend rallies and cyclical bull markets. During 2016 the uranium sector likely reached the end of a vicious bear market cycle which began in March 2011 with the Fukushima disaster. The combination of sentiment on the sector reaching the depths of despair and an impressive broad based chart pattern double-bottom help us to reach this conclusion.
Zooming in a bit closer we can see that the ~70% rally from the November low ran into an area of previous support from early 2015:
URA (Weekly)

It is also worth noting that the volume required to drive this rally has been nothing short of enormous by historical standards; it's taken a ton of motivated buying to drive the uranium sector up 70% - this week will be the highest volume week in the history of the URA exchange-traded fund and Monday-Wednesday saw consecutive record volume trading sessions.
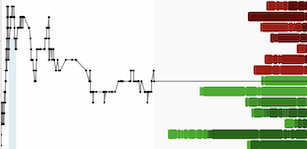
Zooming in even closer to a daily chart we can see how the rally from the November low has unfolded:
URA (Daily)

The first move up from November-December saw a steady accumulation which gradually drove prices higher. This was followed by a 3-week consolidation which gave way to a powerful rally at the beginning of January. The initial January rally saw 11 consecutive up days on increasing volume which resulted in a ~35% advance.
The ~$17 level turned out to be minor resistance before buyers tired which led to a sharp 2-day pullback. The 3rd wave higher which appears to have ended yesterday morning brought URA to another fresh 52-week high and the highest level since June 2015.
A few things stand out about the 3rd leg higher of the uranium sector advance since November:
- It was the shortest leg (both in terms of # of days and percentage price advance) of the rally.
- Wednesday, the 25th, saw a gap higher followed by a 'trend down day' on record trading volume - price tops made on days in which the market gaps higher have a strong tendency to be more significant and hold up longer.
- Wednesday's high came with a bearish momentum divergence and anecdotally, there was also a sentiment divergence with perhaps the most bullish sentiment in years on the uranium space while share prices have largely doubled or tripled in the span of less than three months.
- Before putting in an intermediate or longer term top parabolic rallies have a tendency to pull-back before making another marginal high - this phenomenon overloads the 'bullish boat' to the point that when it 'tips over' it has longer lasting repercussions.
In summary, from my perch I see a good chance that the uranium sector just put in an intermediate-term top that could last anywhere between a couple months to an entire year.
Disclosure: I am short $URA since yesterday and I may cover this short position at any time without notice - to follow my trades and market analysis in real time subscribe to the Trading Lab today!
DISCLAIMER: The work included in this article is based on current events, technical charts, and the author’s opinions. It may contain errors, and you shouldn’t make any investment decision based solely on what you read here. This publication contains forward-looking statements, including but not limited to comments regarding predictions and projections. Forward-looking statements address future events and conditions and therefore involve inherent risks and uncertainties. Actual results may differ materially from those currently anticipated in such statements. The views expressed in this publication and on the EnergyandGold website do not necessarily reflect the views of Energy and Gold Publishing LTD, publisher of EnergyandGold.com. This publication is provided for informational and entertainment purposes only and is not a recommendation to buy or sell any security. Always thoroughly do your own due diligence and talk to a licensed investment adviser prior to making any investment decisions. Junior resource companies can easily lose 100% of their value so read company profiles on www.SEDAR.com for important risk disclosures. It’s your money and your responsibility.
A few things stand out about the 3rd leg higher of the uranium sector advance since November:
- It was the shortest leg (both in terms of # of days and percentage price advance) of the rally.
- Wednesday, the 25th, saw a gap higher followed by a 'trend down day' on record trading volume - price tops made on days in which the market gaps higher have a strong tendency to be more significant and hold up longer.
- Wednesday's high came with a bearish momentum divergence and anecdotally, there was also a sentiment divergence with perhaps the most bullish sentiment in years on the uranium space as share prices have largely doubled or tripled in the span of less than three months.
- Before putting in an intermediate or longer ter top parabolic rallies have a tendency to pull-back before making another marginal high - this phenomenon overloads the 'bullish boat' to the point that when it 'tips over' it has longer lasting repercussions.
In summary from my perch I see a good chance that the uranium sector just put in an intermediate-term top that could last any where between a couple months to an entire year.
Disclosure: I am short $URA since yesterday and I may cover this short position at any time without notice - to follow my trades and market analysis in real time subscribe to the Trading Lab today!
DISCLAIMER: The work included in this article is based on current events, technical charts, and the author’s opinions. It may contain errors, and you shouldn’t make any investment decision based solely on what you read here. This publication contains forward-looking statements, including but not limited to comments regarding predictions and projections. Forward-looking statements address future events and conditions and therefore involve inherent risks and uncertainties. Actual results may differ materially from those currently anticipated in such statements. The views expressed in this publication and on the EnergyandGold website do not necessarily reflect the views of Energy and Gold Publishing LTD, publisher of EnergyandGold.com. This publication is provided for informational and entertainment purposes only and is not a recommendation to buy or sell any security. Always thoroughly do your own due diligence and talk to a licensed investment adviser prior to making any investment decisions. Junior resource companies can easily lose 100% of their value so read company profiles on www.SEDAR.com for important risk disclosures. It’s your money and your responsibility.
