


While equity futures are set to open higher yet again, a nice chart tour from BAML this morning helps to illustrate the mounting equity market warning signs:


VIX futures speculators are at a record short position just as realized equity volatility is at multi-decade lows and fast approaching all-time low levels.
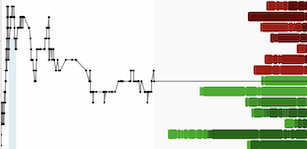
A chart I posted on CEO.CA after the close yesterday helps to illustrate the dynamic of implied volatility as represented by the VIX bottoming and beginning to turn higher as realized volatility continues to decline (ATR at top):

The combination of mounting warning signs against the backdrop of an extremely placid market certainly raises both of my eyebrows.
DISCLAIMER: The work included in this article is based on current events, technical charts, and the author’s opinions. It may contain errors, and you shouldn’t make any investment decision based solely on what you read here. This publication contains forward-looking statements, including but not limited to comments regarding predictions and projections. Forward-looking statements address future events and conditions and therefore involve inherent risks and uncertainties. Actual results may differ materially from those currently anticipated in such statements. The views expressed in this publication and on the EnergyandGold website do not necessarily reflect the views of Energy and Gold Publishing LTD, publisher ofEnergyandGold.com. This publication is provided for informational and entertainment purposes only and is not a recommendation to buy or sell any security. Always thoroughly do your own due diligence and talk to a licensed investment adviser prior to making any investment decisions. Junior resource companies can easily lose 100% of their value so read company profiles on www.SEDAR.comfor important risk disclosures. It’s your money and your responsibility.
